Lec 1 - Downloading R and plot your first graph
STAT 1010 - Fall 2022
Download R
For our course we will be using R and RStudio. Use the QR code below or click here..

A new IDE
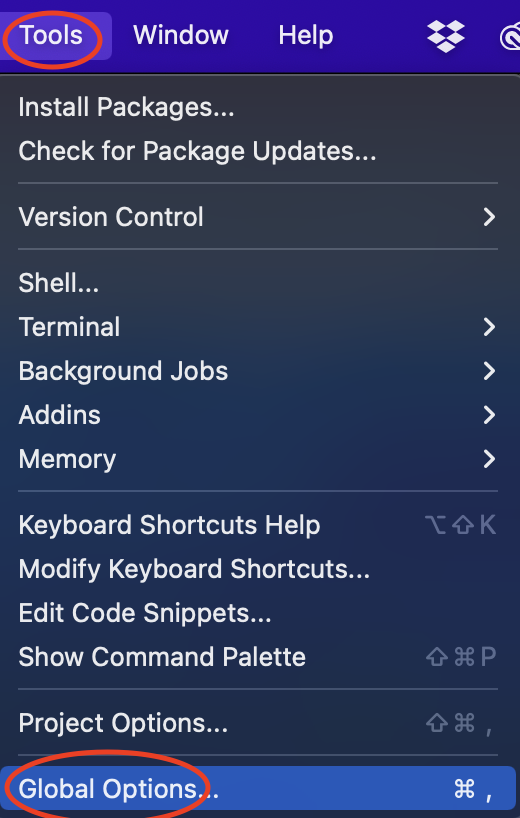
Update global option
Workspace image
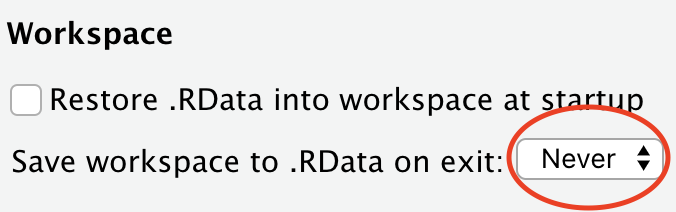
Saving workspace
Rainbow parenthesis
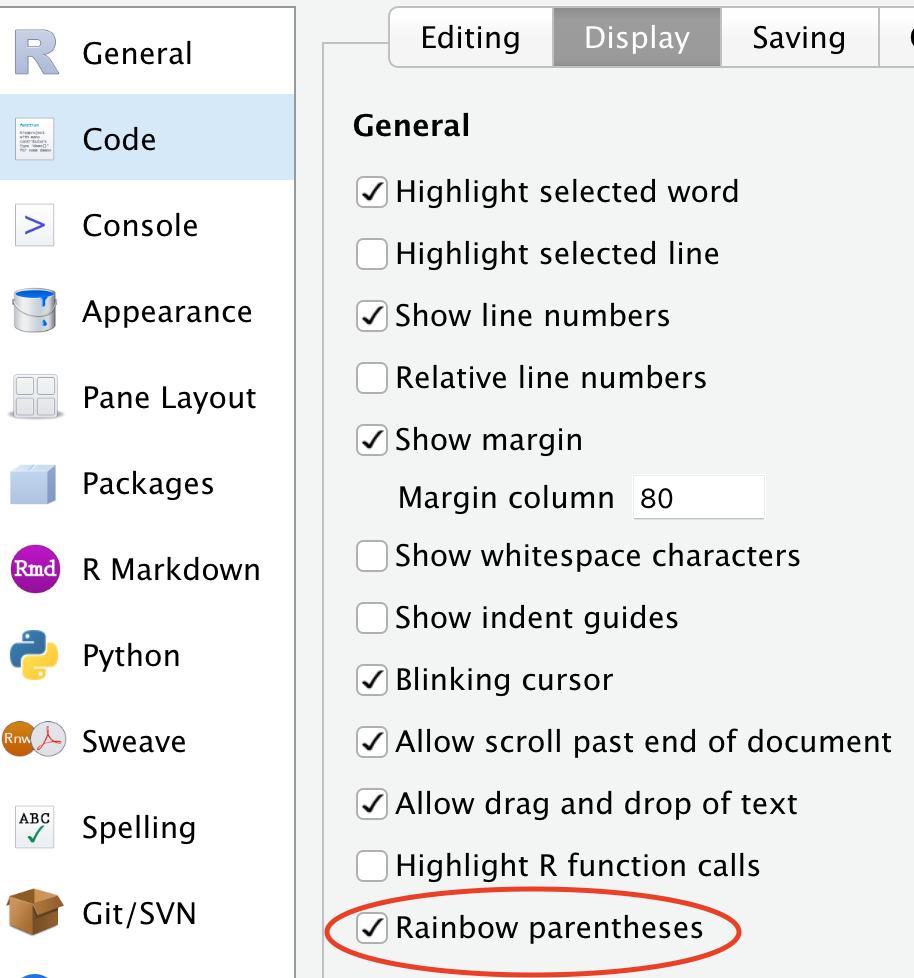
Parenthesis are important
Code font
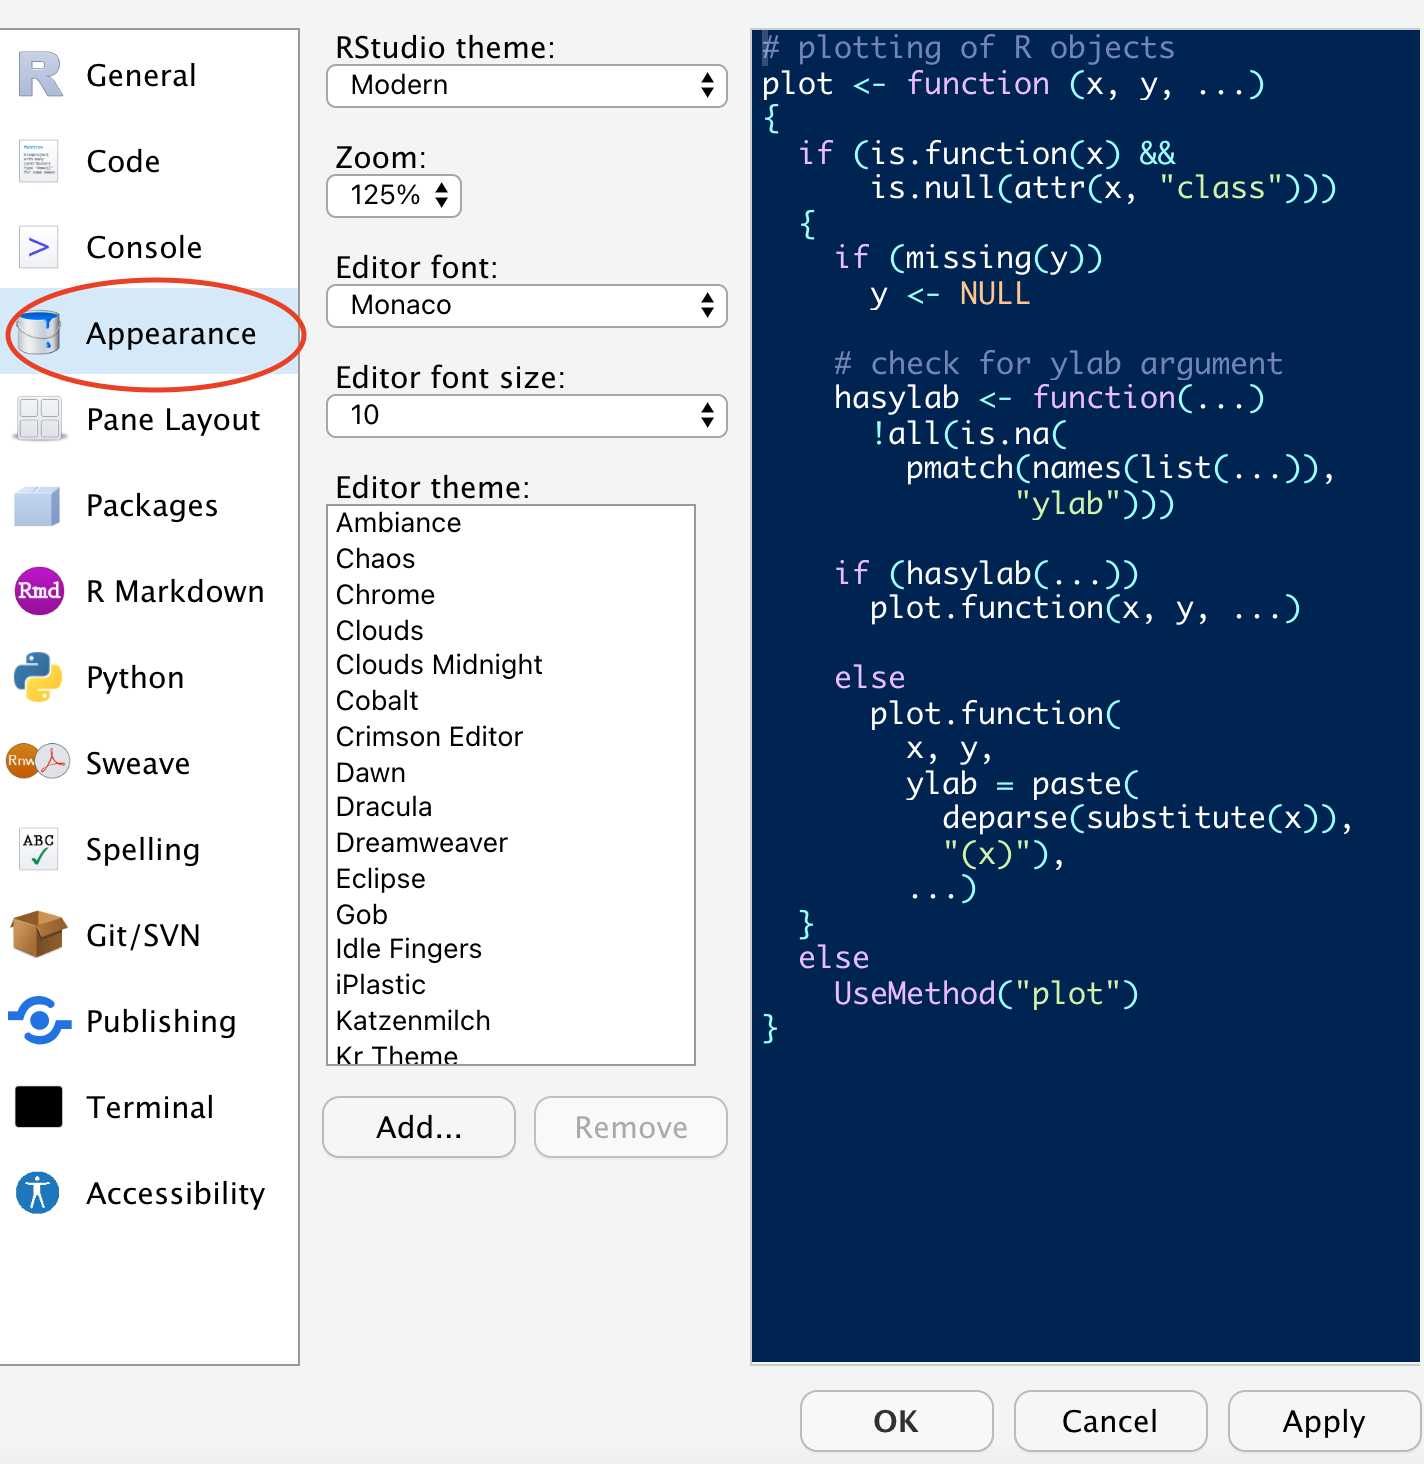
Update background and font color of code
Pane layout
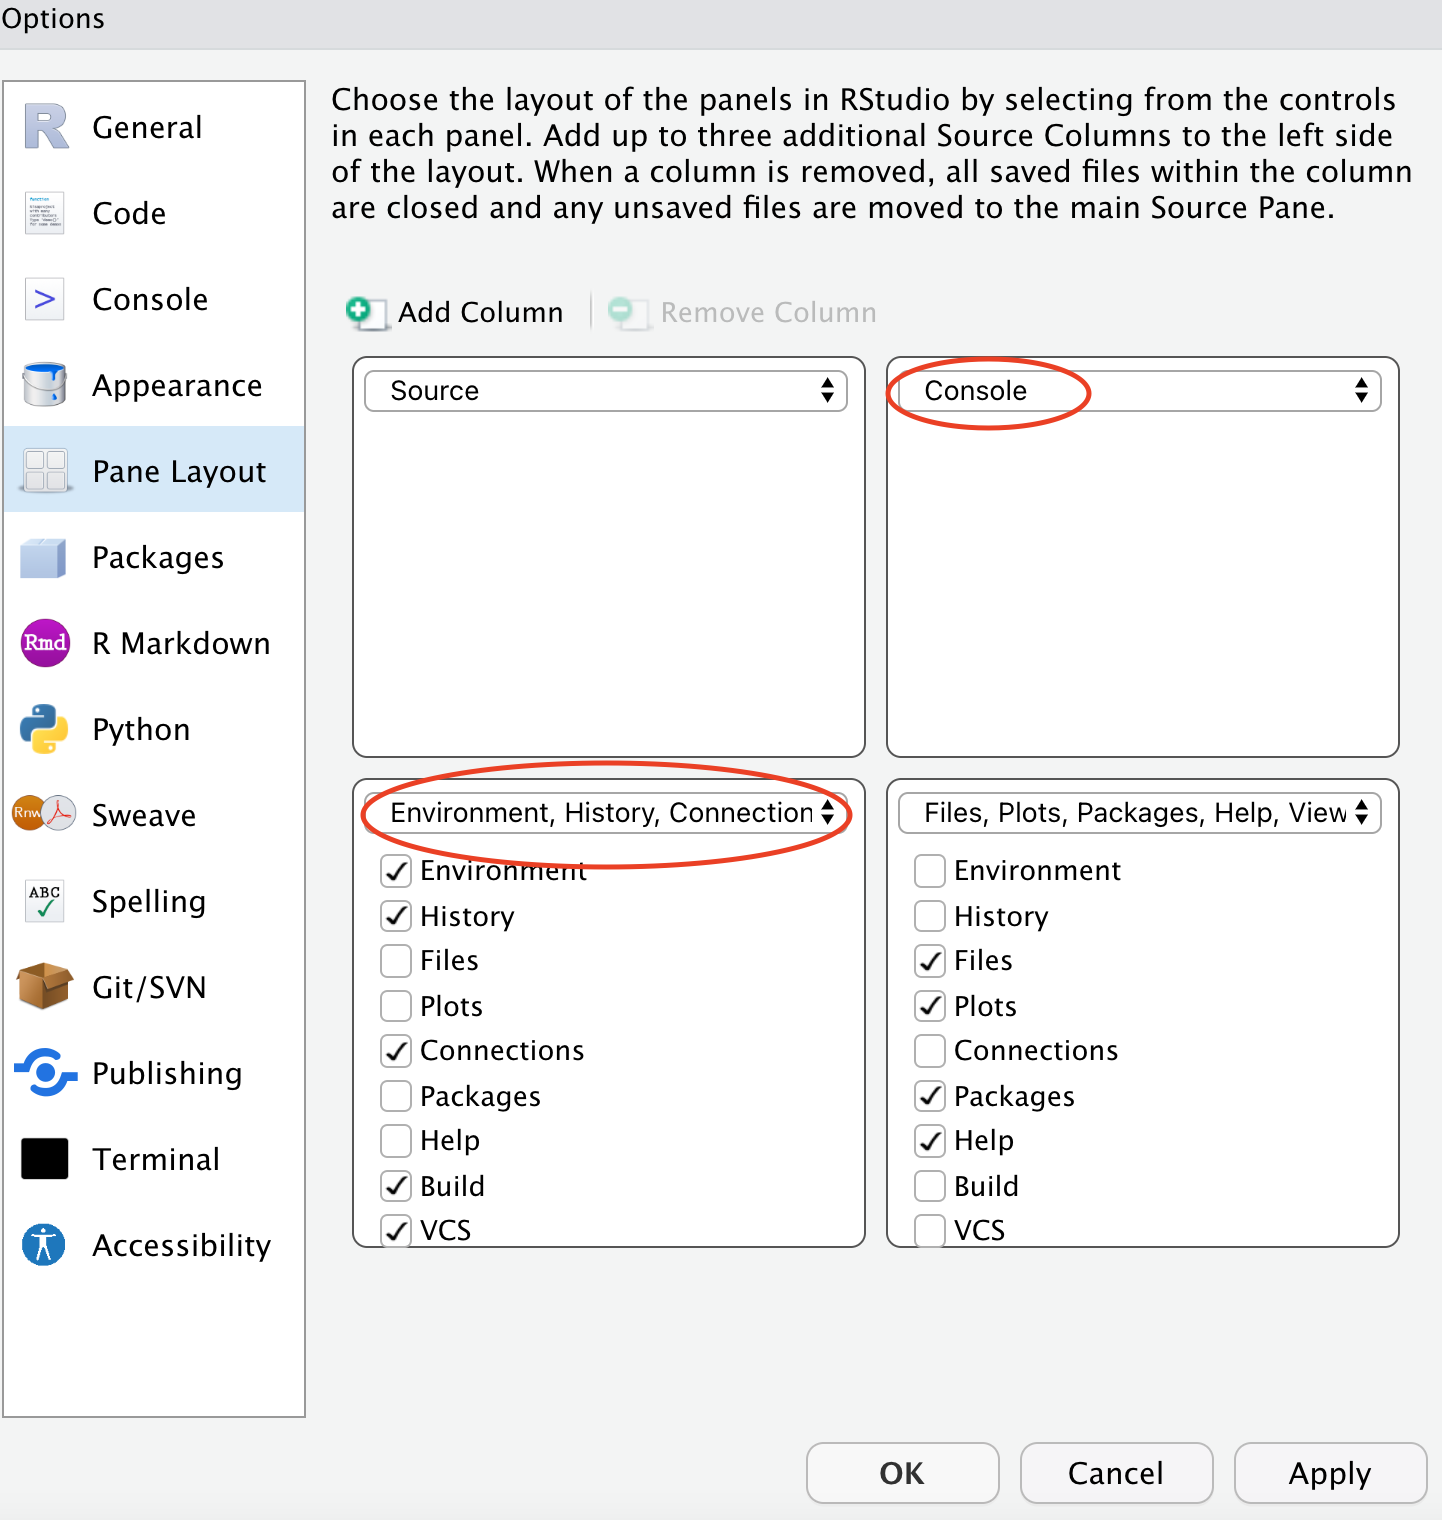
Update panes and their layout
Start a project
Open RStudio and do the following:
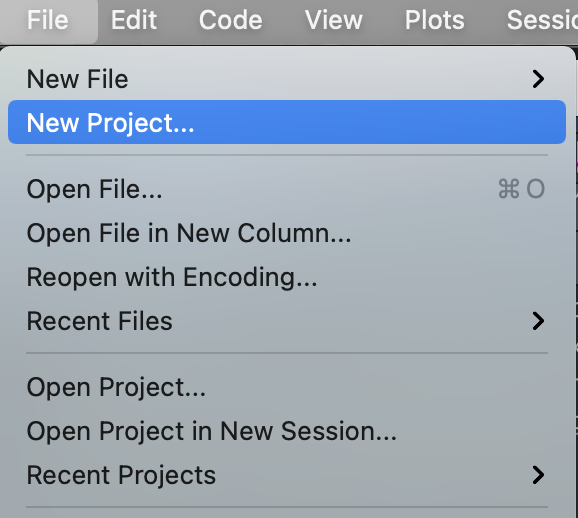
Start a new project in RStudio
New directory
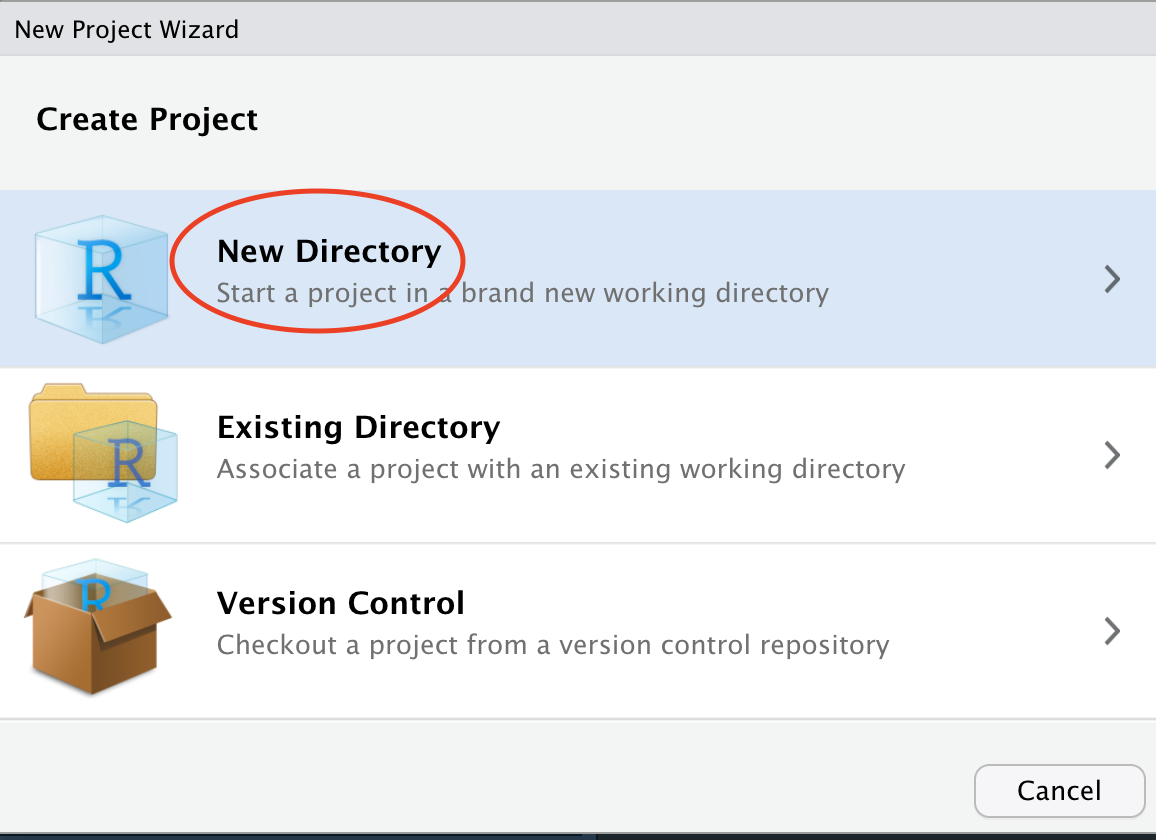
Select “New Directory”
Directory type
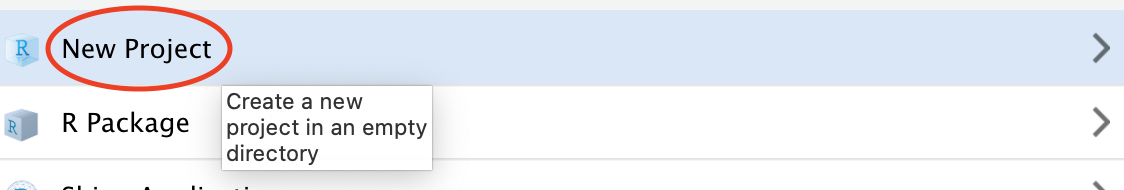
Then select “New Project”
New folder
Hit the “Browse” button, then the “New Folder” button and name it “Stats1010.” All work related to this class will be in this folder, and we will create a new document for each chapter and homework.
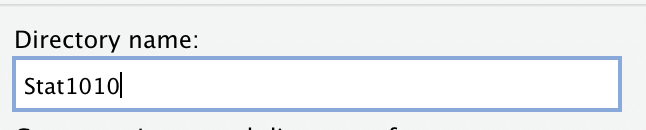
then hit “Create project.”
Start a document
Quarto is a recently developed framework that interactively connects to multiple programming languages and allows for advanced statistical work to be linked to word processing with ease. It will be the basis for our course and for data analysis.
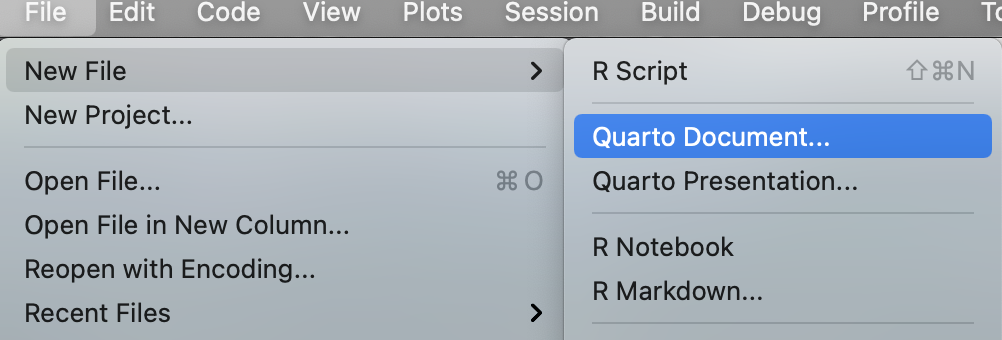
Starting a new quarto file
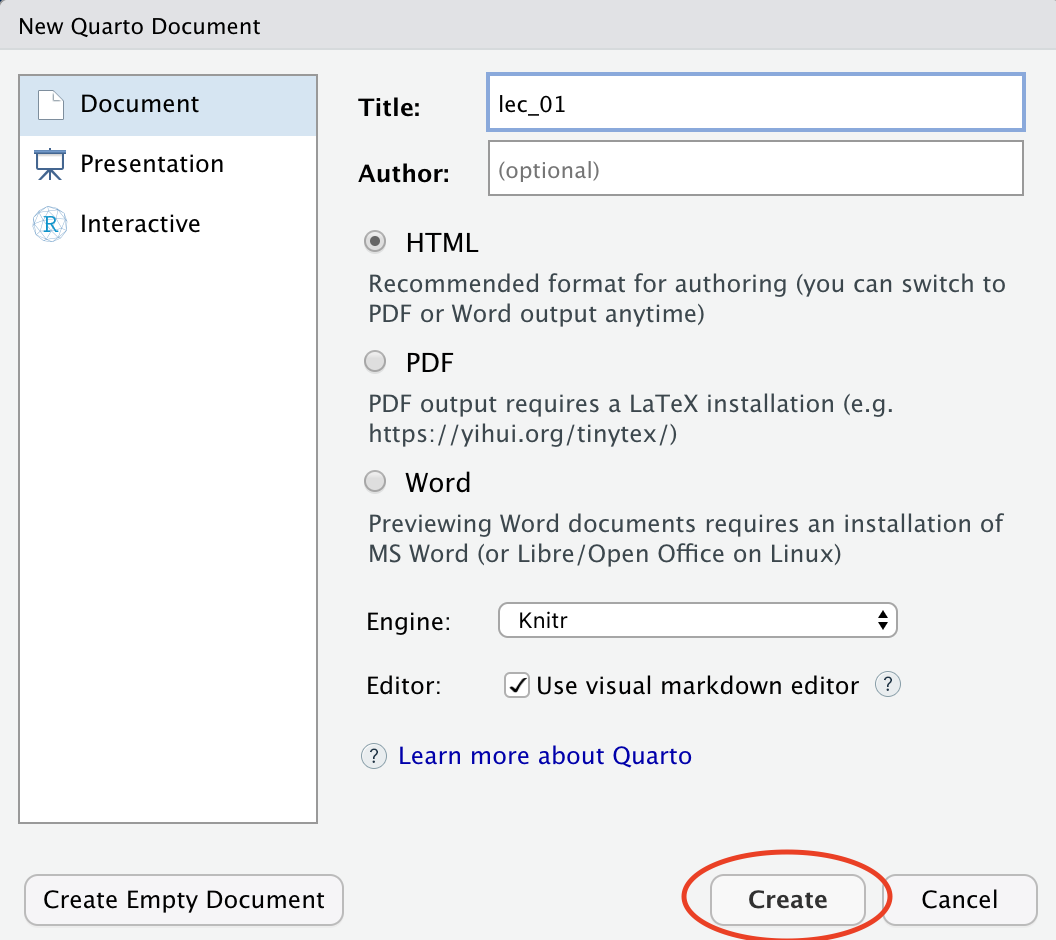
Name the document
Name the document “lec_01” and hit create
Naming the document
Insert an R code chuck
Insert a code chunk
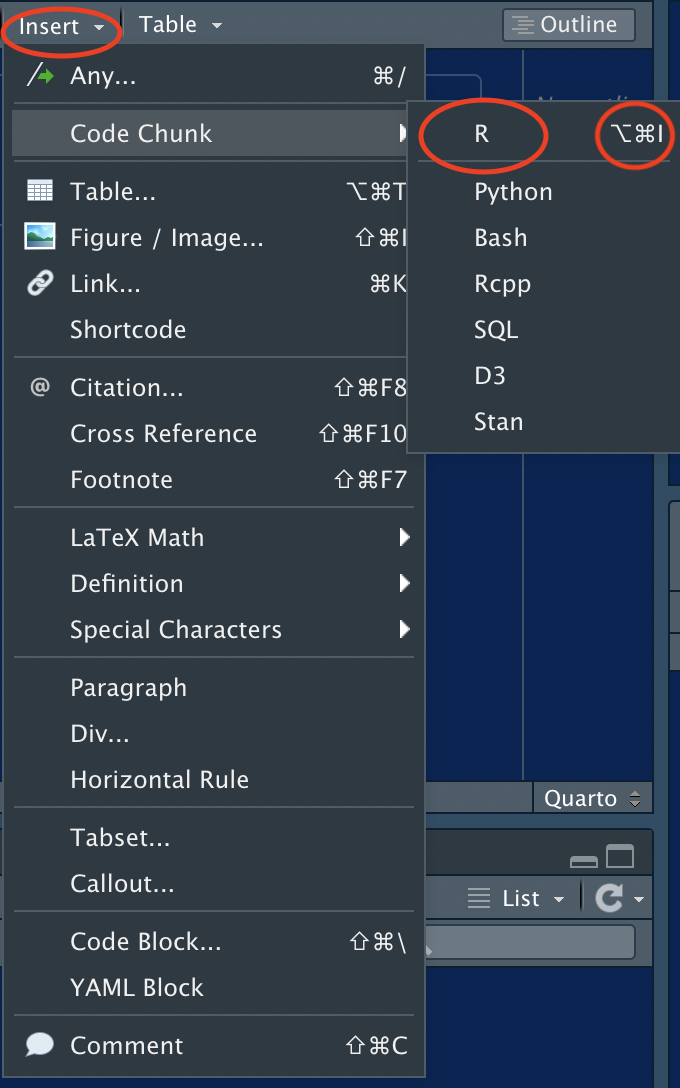
Insert code chunk
Write your first line of coding
Click here or the qr code below to write your first line of code